Marginal income tax rates for a single California resident with only wage income, 2007
As I did some taxes this year (March 2008), going through some of the
forms (by hand, as I always do, partly since I like to understand what
it is that I'm paying) made me realize how bizarre our tax system
is.
Consider the following relatively simple example: a single
(non-dependent) person in California earning all of their income from
wages, salaries, and tips. (Once antipoverty programs like the Earned
Income Credit aren't relevant, this assumption could be relaxed to allow
income from many other sources as well, although capital gains are taxed
differently.) Assume further that this person's withholding is perfect
so that they can deduct exactly their 2007 state taxes from their
federal returns once they get to the point of itemizing deductions
(rather than having some variation from year to year due to imperfect
withholding). Consider the effect of the following taxes:
- US Income Tax
- progressive
rate with some initial income excluded due to subtracting standard
deduction and exemption amounts, with deductions itemized once it
becomes worth itemizing deductions (rather than taking the standard
deduction) based on state taxes paid alone (see two California taxes
below)
- Social Security Tax
- 6.2% of income under $97500 (ignoring that it's really
double that because the employer pays the same)
- Medicare Tax
- 1.45% of income (ignoring that it's really
double that because the employer pays the same)
- US Alternative Minimum Tax
- A separate
progressive tax structure that allows fewer deductions, forcing rich
people to give up some of their itemized deductions if this structure
produces a larger tax than the normal tax structure.
- California Income Tax
- progressive
rate with some initial income excluded due to subtracting the
standard deduction and exemption amounts
- California State Unemployment/Disability Insurance
- 0.6% of income under $83388.33
- Earned Income Credit
- A federal antipoverty program that subtracts from income tax
(potentially making it negative). Doesn't pay much to people without
children, so doesn't figure much here.
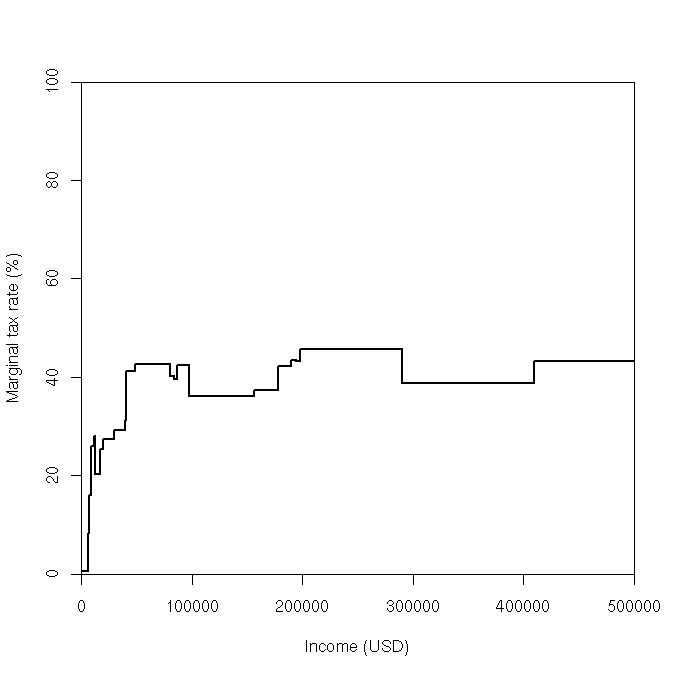
This yields the marginal rates shown in the following graph:
And here's a zoom of the part of the graph under $100,000:
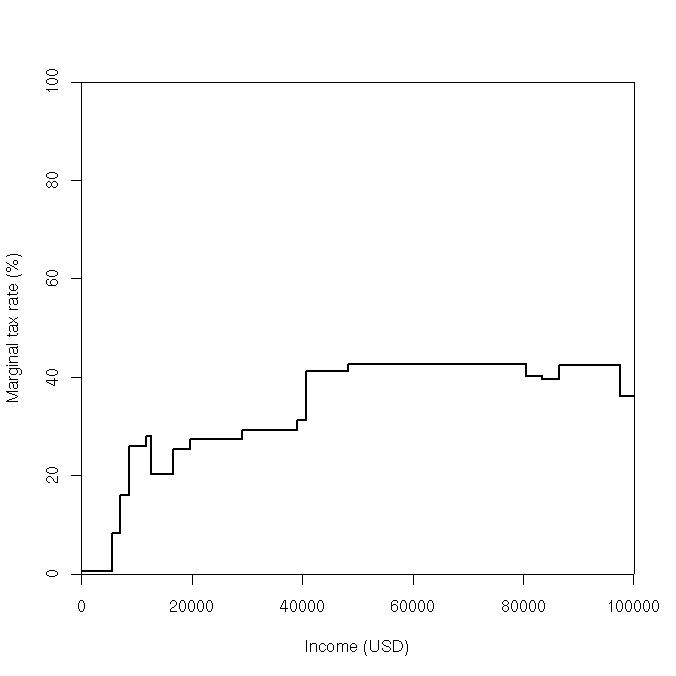
One way to understand what this graph represents is that if a person
meeting these conditions drew a vertical line at their income, the area to
the left of that line would be everything they earned. The part below the
line drawn would be the part paid in taxes, and the part above would be
the part they keep.
[ Edit, May 12, 2010 -- The reason I called these graphs
bizarre isn't the magnitude of the numbers; they're in the range one
would expect for funding a modern government. What's bizarre about
these graphs is their shape. There is no good reason for this graph to
have lots of bumps in it. I'd expect a line that's gradually increasing
(perhaps stepwise), not one that goes up and down a lot. I think the
bumps are a result of the bad process we use for making policy. --
end Edit]
The details of these marginal rates are:
- Thanks to standard deductions and dependent exemptions (since the
taxpayer has himself as a dependent), both federal and California income
taxes don't kick in immediately. However, the Earned Income credit does
(at a rate of -7.65%), so the initial marginal rate is
0.6% when subtracting that credit from the other three
taxes. (This ignores other antipoverty programs, though.)
- Around $5550 (where the total tax paid is around $33.30),
the Earned Income Credit changes to a flat $428, bringing the marginal
rate up to the rate of Social Security plus Medicare plus California
SUI/SDI, which is 8.25%.
- Around $7000 (where the total tax is around $150), the
Earned Income Credit starts decreasing. (This is for single people; for
people with children it's still increasing (not even flat yet) at this
income level.) This brings the marginal rate up to
15.9%.
- At $8750 (where the total tax is around $428),
we've used up the federal standard deduction and 1 exemption, so federal
income taxes kick in at 10%, making the marginal rate
25.9%
- At $11629 (where the total tax is around $1174),
we've used up California's standard deduction ($3516) and the $94
after-tax exemption for supporting oneself, so California
income taxes kick in at a marginal rate of 2%, making the total marginal
rate 27.9%.
- At $12590 (where the total tax is around $1442),
the Earned Income Credit has hit 0, so the total marginal rate drops to
20.25%.
- At $16575 (where the total tax is around $2249),
the federal income tax rate goes up to 15%, so the total marginal rate
is 25.25%
- At $19701 (where the total tax is around $3038),
the California income tax rate goes up to 4%, so the total marginal rate
is 27.25%
- At $29060 (where the total tax is around $5588),
the California income tax rate goes up to 6%, so the total marginal rate
is 29.25%
- At $38976 (where the total tax is around $8489),
the California income tax rate goes up to 8%, so the total marginal rate
is 31.25%
- At $40600 (where the total tax is around $8996),
the Federal income tax rate goes up to 25%, so the total marginal rate
is 41.25%
- At $48330 (where the total tax is around $12185),
the California income tax rate goes up to 9.3% (the top bracket), so the
total marginal rate is 42.55%
- At $80460.81 (where the total tax is around
$25857), total payments of income taxes to California now equal the
federal standard deduction ($5350), so it becomes worth itemizing
deductions on federal taxes. The marginal rate for total California
taxes is 9.9%. This means that 9.9% of each additional dollar doesn't
count towards federal income tax, reducing its effective marginal rate
from 25% to 22.525%, making the total marginal rate
40.075%.
- At $83388.33 (where the total tax is around
$27030), the maximum payment into California state disability and
unemployment insurance ($500.33) is paid. This, in turn, reduces the
total marginal rate of state taxes to 9.3%, which increases the
effective federal income tax marginal rate (remember the last step) to
22.675%, making the total marginal rate 39.625%
- Around $86421.96 (where the total tax is around
$28232), the Federal income tax rate goes up to 28%. Remember we're
deducting 9.3% of income, though, so the total marginal rate is
42.346%
- At $97500 (where the total tax is around $32923),
Social Security taxes stop, so the total marginal rate is
36.146%
- At $156400 (where the total tax is around $54215),
Federal exemption and deduction limiting kicks in, the former in a
series of discrete jumps of $12.69 each (1.181333% slope), and the
latter continuously (at a 7.3% slope). Around the same point (actually
the first step is at $156666, but treating it as a continuous function
it starts at $155416), California exemptions start being limited as
well. Since this is a very small effect: a series of $4.32 steps for
every increment of $2500 in income ($6 more in California tax, minus the
offset that causes in Federal tax), I'll just throw it in here as well.
Treating all of these as continuous, this makes the total marginal rate
around this point change to approximately 37.39%.
- At an income of $177914.32 (where the total tax is
around $62258), the Federal tax rate goes up to 33%, changing the total
marginal rate to approximately 42.1%.
- At an income of $190153.08 (where the total tax is
around $67411), the alternative minimum tax kicks in (with the
alternative structure passing the regular income tax structure), and the
total marginal rate changes to 43.49%. Note that even
with small amounts of income from capital gains, this can happen at
significantly lower income, because the alternative minimum tax's steep
exemption phaseout does include capital gains (whereas almost nothing
else does).
- Around an income of $194582.66 (assuming a
continuous function, which it really isn't), the California exemption
hits zero (so the gradual limiting stops), and the marginal rate drops
to 43.25%.
- At $197980 (where the total tax is around $70807),
the alternative minimum tax rate jumps from 26% to 28% (though the
effective rate is larger, jumping here from 32.5% to 35%, since the AMT
exemption limiting is still being phased in), making the total marginal
rate now 45.75%.
- At $289900 (where the total tax is around $112860),
the AMT exemption is now limited down to zero, which makes the federal
income tax marginal rate drop to the AMT's official 28%, making the
total marginal rate now 38.75%.
- At $409665.88 (where the total tax is around
$159269), the regular federal income tax rate schedule (with its now
higher marginal rates) crosses above the alternative minimum tax again,
making the total marginal rate now 43.195%. This is
the marginal rate on income from this point up (given these very simple
assumptions).
I probably made a whole bunch of mistakes here, never mind the major
pieces I omitted, but this seesaw graph starts to paint a picture of the
US tax system. It has so many details and patches to fix little things
that the big picture is a mess.
I think I'd probably prefer a graduated (and actually progressive)
tax on consumption (allowing major purchases like houses and cars to be
treated as investments, consuming only the fair market value of the
opportunity cost of not renting it). This could be done through a
mechanism similar to the one we have now (but simpler), except where
savings are deductable and loans are taxable.
See the Haskell program that I used to
figure a bunch of this out, as well as the data and R code
that I used for the plot.
David Baron, dbaron@dbaron.org, 2008-03-17